Case file 23-150K Fort Wayne, Indiana
Crime is
patterned,
not random.
A careful look at where, when, and how likely crime incidents appeared across Fort Wayne in 2023.
Evidence board / 2023
30,336likely crime incidents
Only 1 in 5 raw entries made the crime-focused cut.
46.7%
property crime
property crime
Validity
over volume
over volume
01 / The assignment
The raw file was a police activity log, not a crime database.
Traffic stops, alarms, welfare checks, EMS calls, follow-ups, and citizen assists lived beside offense records. Summarizing everything would tell the wrong story, so the first task was deciding what belonged in a defensible crime-focused dataset.
- Role
- Data analysis & visualization
- Tools
- Python, Pandas, Matplotlib
- Focus
- Time, category & location patterns
02 / Build the evidence
154,478 rows entered.
30,336 incidents remained.
The conservative filter favored clear crime patterns, such as theft, assault, vandalism, OWI, and weapons, and excluded service calls.
03 / What happened
Property crime takes up nearly half the board.
Hit-and-run looks like the largest single offense at first glance. Combine theft-related labels, however, and property loss and damage become the dominant volume story.
04 / When it happens
Summer gets louder.
Weekends do too.
July averaged 93.55 incidents per day, the highest month. Friday through Sunday accounted for 44.8% of all likely crime incidents.
Vehicle-related peak
Violent crime peak
Drug / alcohol peak
Strongest property window
!
Midnight is a mirage. It appears as the most common hour largely because of a data-entry artifact, not a real behavioral peak.
Fort Wayne
hotspot sketch
05 / Where it clusters
Commercial corridors create opportunity and volume.
The top 10 areas produced 28.1% of all likely crime incidents, while the top 10 corridors accounted for 15.4%.
- 01Coldwater Rd
- 02Lima Rd
- 03W Jefferson Blvd
- 04E Main St
- 05E Washington Blvd
High-volume areas were not automatically high-violence areas. Some lower-volume corridors had twice the city-average violent share.
06 / Read the clock carefully
Reporting lag changes what “time of crime” really means.
07 / The starting point
Plot first. Question the plot second.
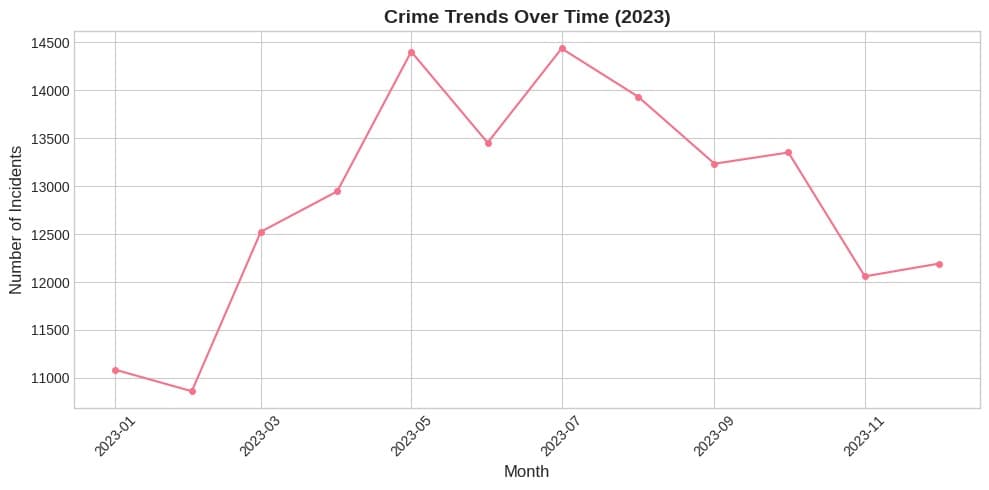
This early view charted every activity record in the source log. It helped reveal the annual rhythm but also exposed why a crime-specific filter was essential before interpreting the pattern.
JAN01135 incidents
Anomaly detected
New Year's Day was the largest spike.
It included 45 violent incidents and 24 shots-fired records. Other multi-category surges appeared on June 24, July 14 during the Three Rivers Festival, September 29, and November 5.
08 / Handle with care
This analysis describes records, not every crime, cause, or neighborhood.
No latitude/longitude or population context
Broad occurrence windows reduce precision
Some offense labels remain ambiguous
Incident logs are not confirmed-crime tables
Case closed / for now
Property crime follows opportunity.
Violent crime follows specific places and times.
The useful result is not one citywide number. It is a more honest map of routine activity, reporting behavior, seasonal pressure, and localized risk.