Computer Science @ Purdue 26
Shreya Komarabattini
Full-stack + AI software engineer turning complex systems into clear, useful products.
I build across frontend, backend, and applied machine learning, from real-time multiplayer experiences to NLP automation and data-driven tools.
Moodle
Online drawing and guessing game you can play with friends. One person draws a secret word while the others try to guess it in the chat. You can make a room, invite others with a code, play against computer players, and even draw using hand gestures with your camera.
Traffic Sign Recognition
Senior Capstone team project focused on developing a mobile application that detects and classifies traffic signs in real time using a trained deep learning model. The app enhances driver safety by delivering fast and accurate traffic sign recognition through a live camera feed.
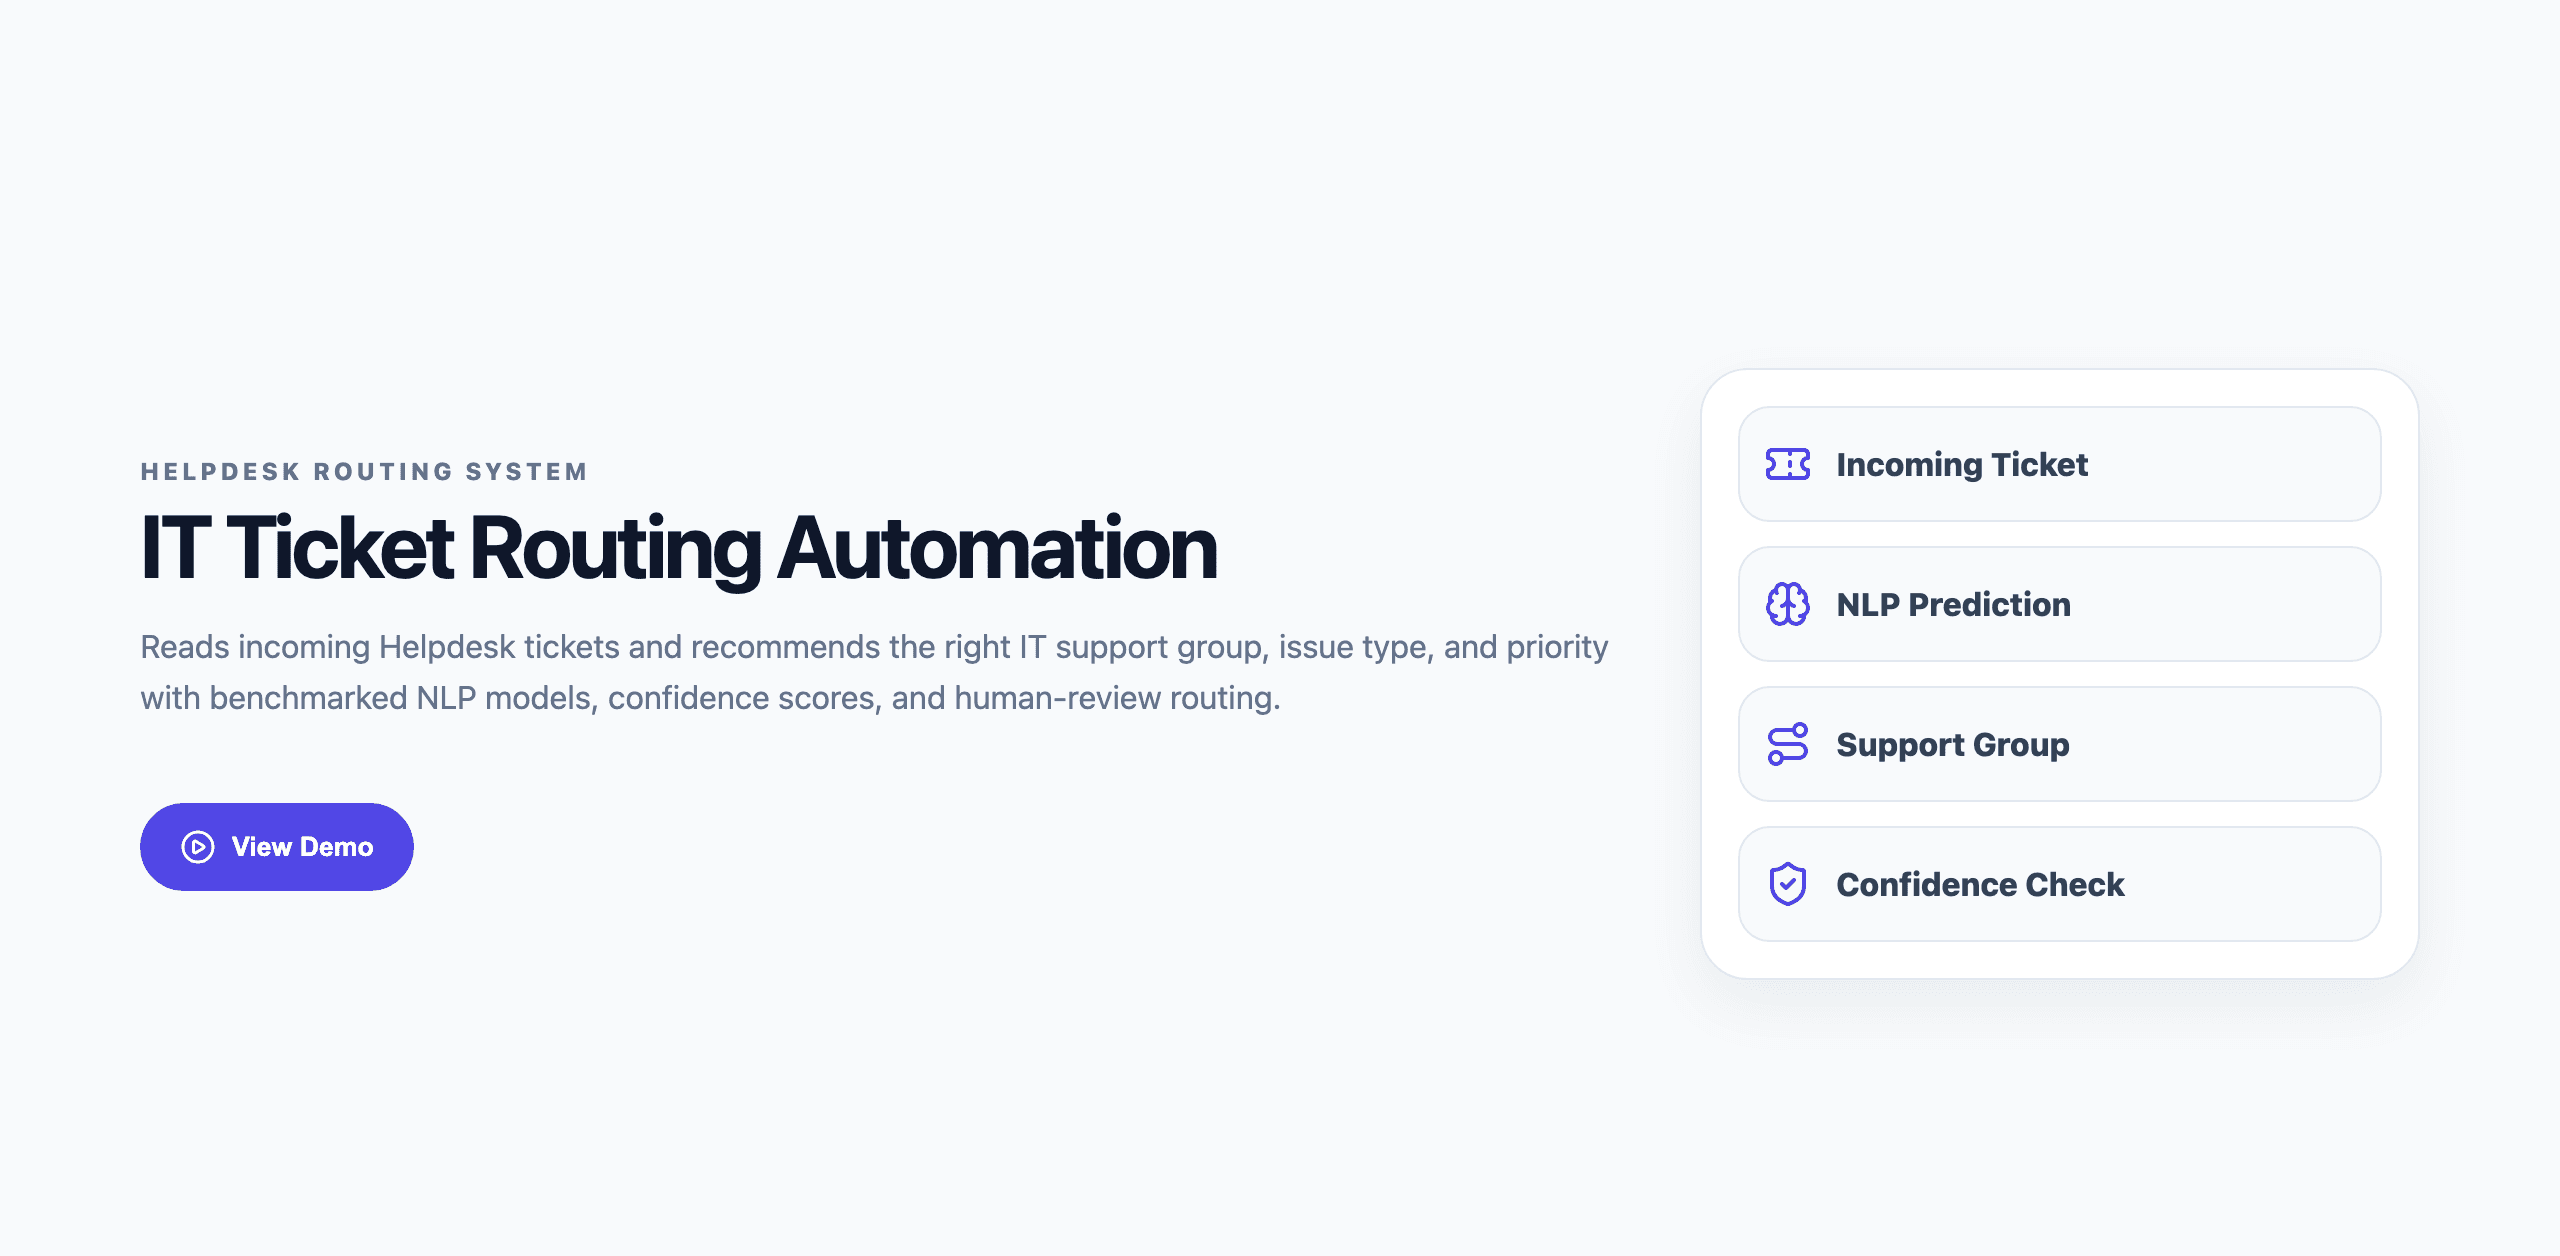
IT Ticket Routing Automation
End-to-end ML web app that reads free-text Helpdesk tickets and routes them to the right IT support group, predicting support group, issue type, and priority across 8 IT groups. Combines a trained NLP pipeline, a FastAPI backend, and a React dashboard with confidence scores and analytics.
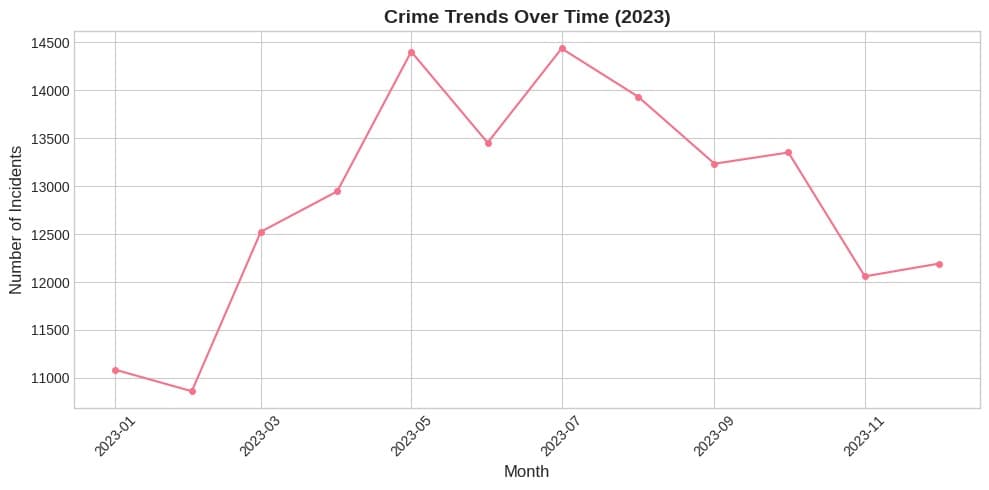
Fort Wayne, Indiana Crime Analysis
Filtered 154,478 police activity rows into 30,336 likely crime incidents, then used Python to surface category, timing, reporting, and corridor-level patterns without overstating what the records prove.
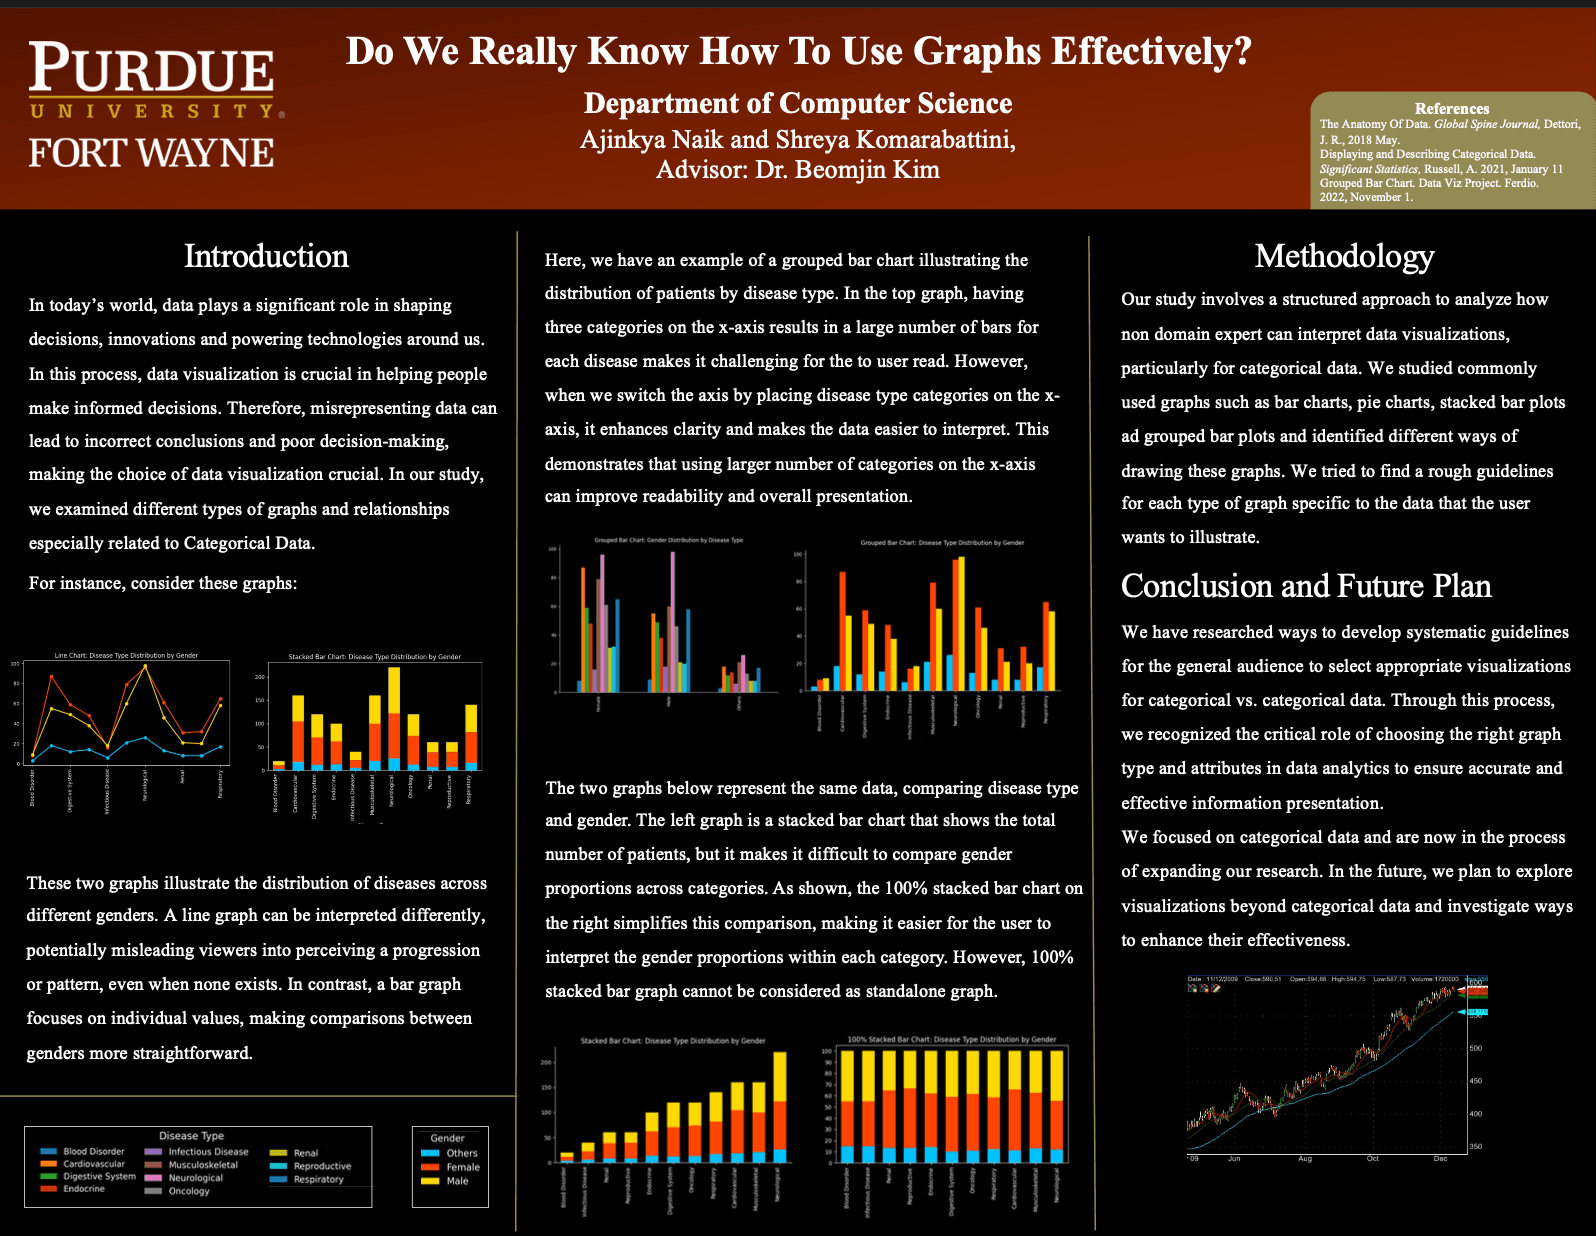
Categorical Data Visualization Study
Investigated how users interpret bar, line, and stacked bar charts. Designed user studies to evaluate visualization clarity, and formulated evidence-based guidelines for better data comprehension. Presented at Purdue's Annual Research Symposium.